Plot method for a cyEffTest object
plot.cyEffTest.Rdplot.cyEffTest, a method to plot the output of
cyEffTest. It is designed to give a quick overview
of a cyEffTest object and to check the assumption of independece between calendar years.
Usage
# S3 method for class 'cyEffTest'
plot(x, type = "l", xlab = "Z", ylab = "Density",
                          main = "Calendar Year Effect", col.area = "gray",
                          border = NA, ...)
Arguments
- x
output from
cyEffTest- type
Default: "l". What type of plot should be drawn
- xlab
Default: "Z". X axis label
- ylab
Default: "Density". Y axis label
- main
Default: "Calendar Year Effect". Plot title
- col.area
Default: "gray". Color of the shaded area.
- border
Default: NULL, the color to draw the border. Use
border = NAto omit borders.- ...
optional arguments. See
plot.defaultfor more details.
Details
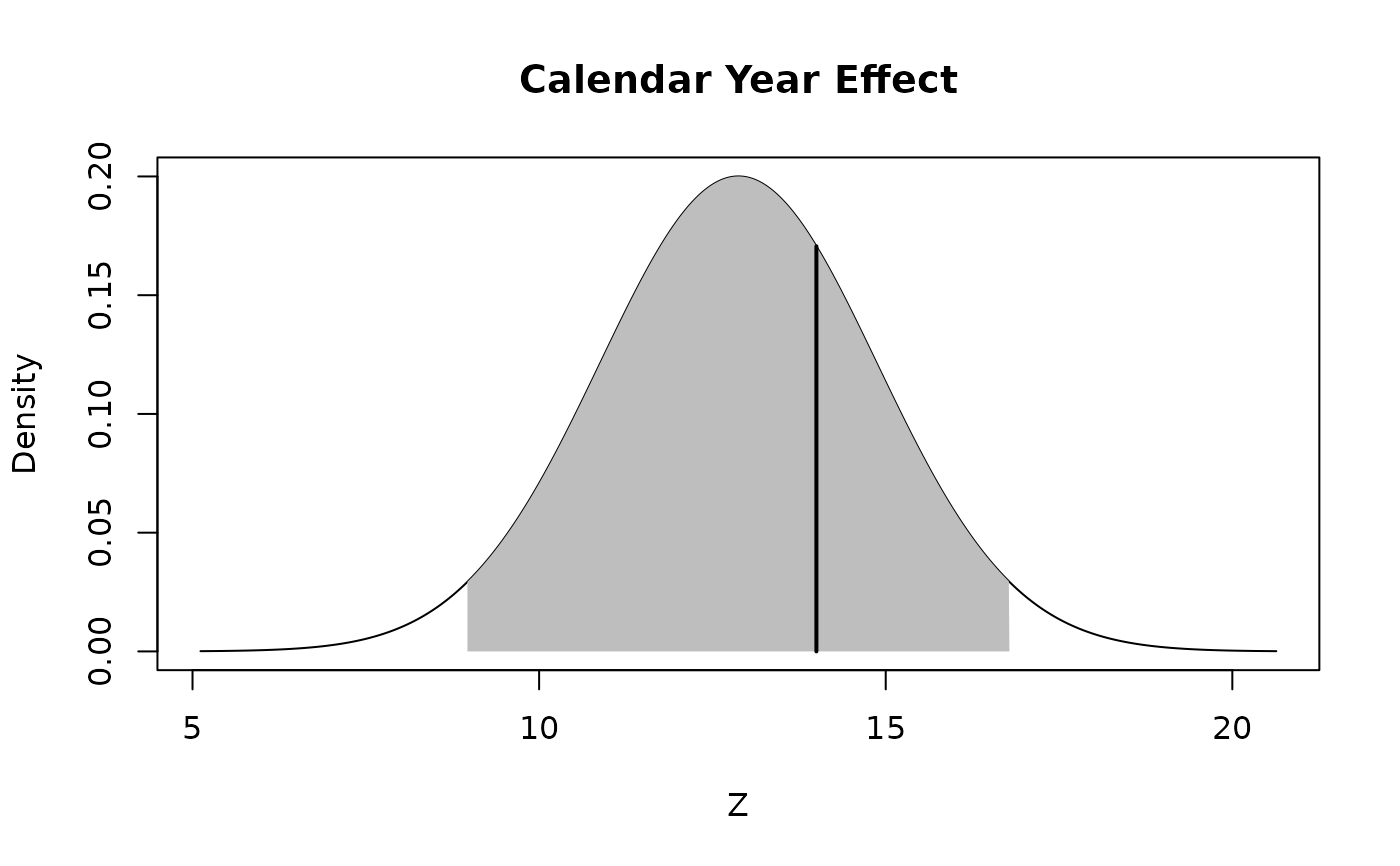
plot.cyEffTest shows the underlying distribution, the test statistic \(Z\) and the relative Confidence Interval.
If the test statistic \(Z\) is within the highlighted region the hypothesis of dependence between calendar years could be rejected.
Author
Marco De Virgilis devirgilis.marco@gmail.com
See also
See Also cyEffTest,
summary.cyEffTest